4 Best Free Open Source Charts Component for Web Page
1. Flot
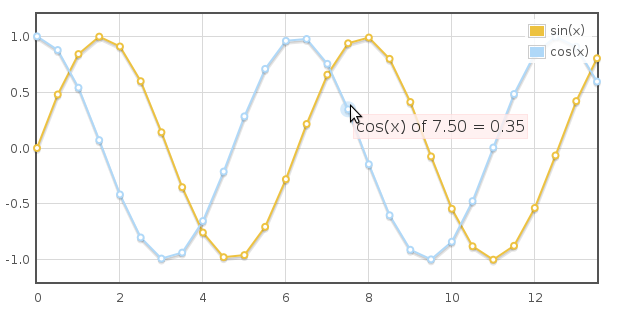
Flot is a pure Javascript plotting library for jQuery. It produces graphical plots of arbitrary datasets on-the-fly client-side.
The focus is on simple usage (all settings are optional), attractive looks and interactive features like zooming and mouse tracking.
The plugin works with Internet Explorer 6/7/8, Firefox 2.x+, Safari 3.0+, Opera 9.5+ and Konqueror 4.x+ with the HTML canvas tag (the excanvas Javascript emulation helper is used for IE).
2.Canvas 3D
Canvas 3D Graph is a special type of bar graph that plot numbers in 3D
This project first started as PHP-GD project, but there is not much sense in generating complex graph like this on server side (script worked really fast, though), so the author rewrite it in javascript
3.JS Charts
JS Charts is a JavaScript chart generator that requires little or no coding. JS Charts allows you to easily create charts in different templates like bar charts, pie charts or simple line graphs.
4.dwpe
dwpe chart is accessible charts and graphs that uses JavaScript to scrape data from an HTML table and generate bar, line, area, and pie chart visualizations using the HTML5 canvas element. This technique provides a simple way to generate charts, but more importantly, because it bases the chart on data already in the page in an HTML table element, it is accessible to people who browse the web with a screen reader or other assistive technology, or with browsers that don’t fully support JavaScript or HTML5 Canvas.


turkiyenin en iyi script sitesi scriptler.com.tr
instantly scrape any website with wpgrab.com